Chapter 4
Job Manager
The Job Manager is the heart of the live-edge system. It is used to configure and monitor jobs that have been set up to capture and verify ad breaks. The TMC state is shown in real-time on this screen. There are several steps to add Live Edge scripts to the TMC and provision set top boxes for our use.
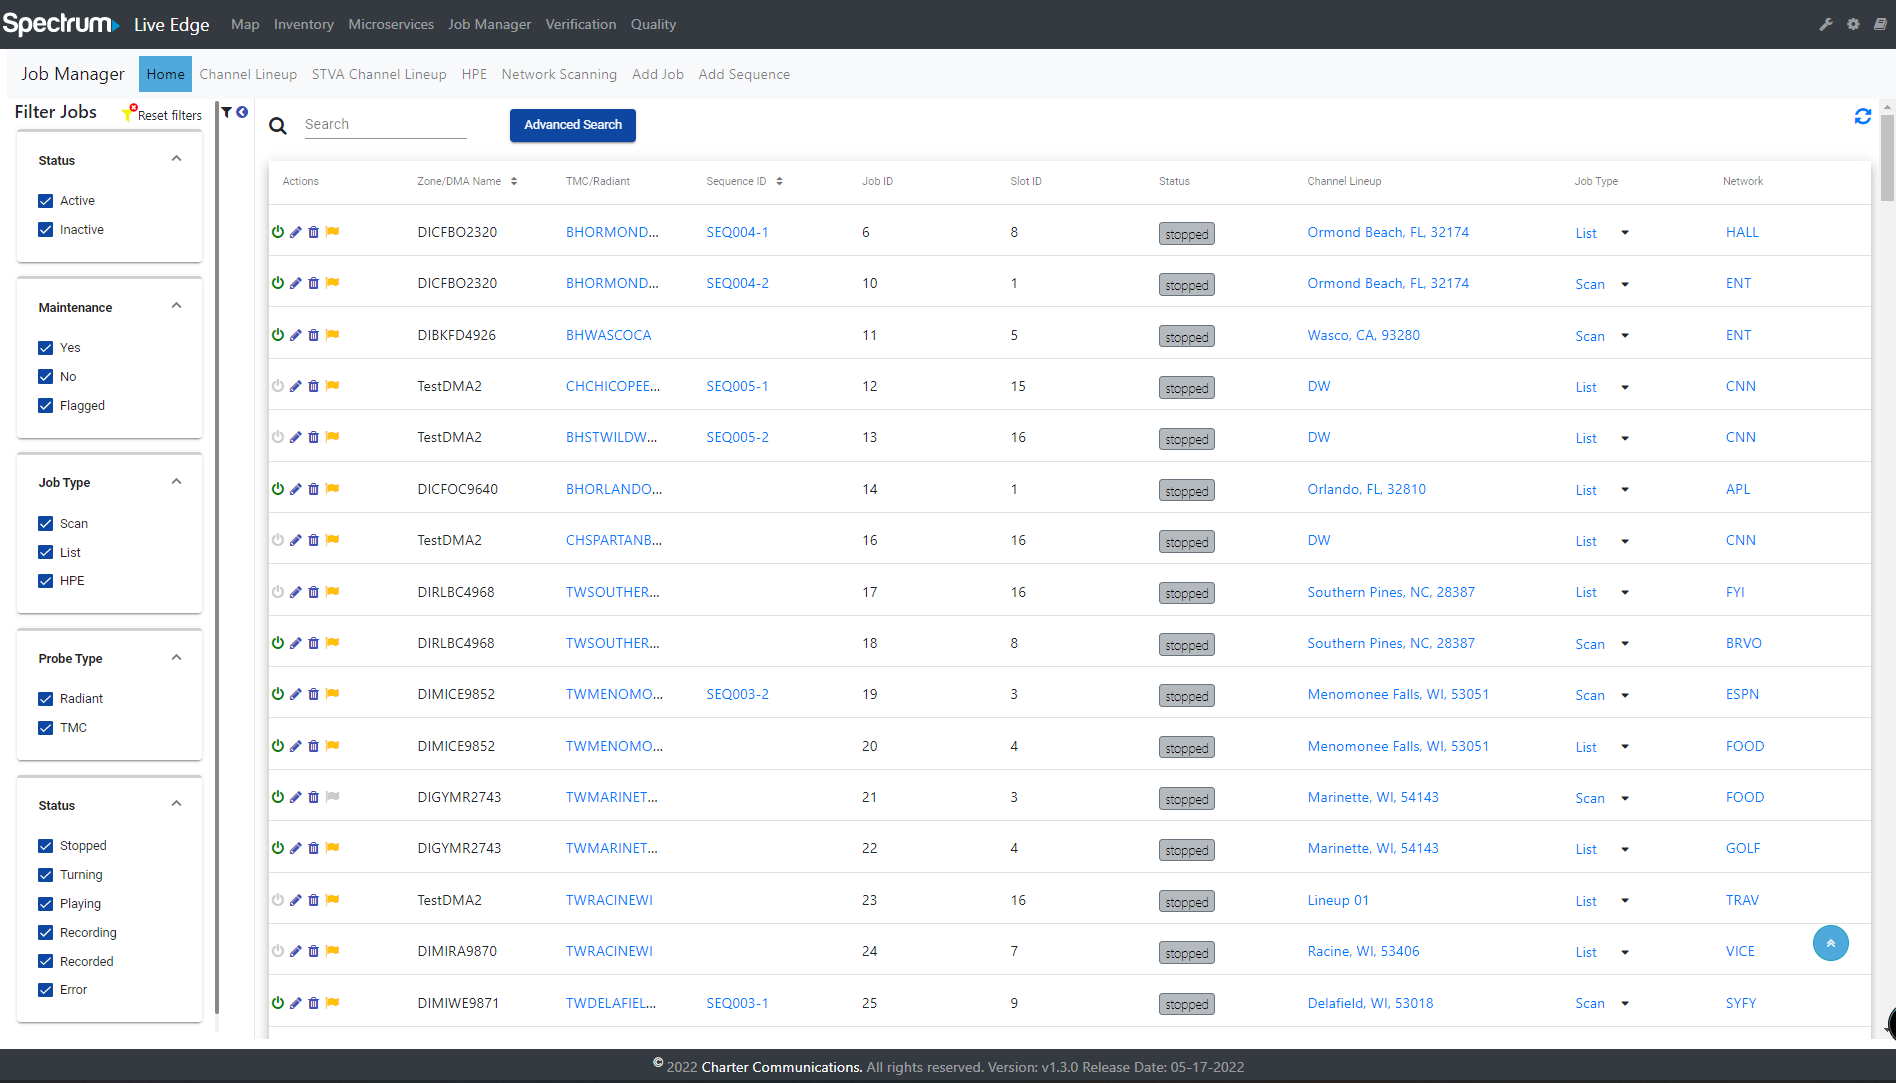
Home
The home view shows the overall status of all the jobs configured to monitor the TMC device and individual set top boxes configured.
The Home page is the default when accessing Job Manager.
Channel Lineup
The Channel Lineup navigation will direct to the Lineup management page.
Channel lineups can be manually created or added using an internal Charter API.
STVA Channel Lineup
The “STVA Channel Lineup” navigation will direct to the STVA Channel Lineup management page.
STVA Channel Lineups are unique lineups used in STVA Jobs running on Roku devices.
HPE
The HPE navigation will direct to the HPE management page.
High Priority Events can be uploaded or added and modified using the HPE screen.
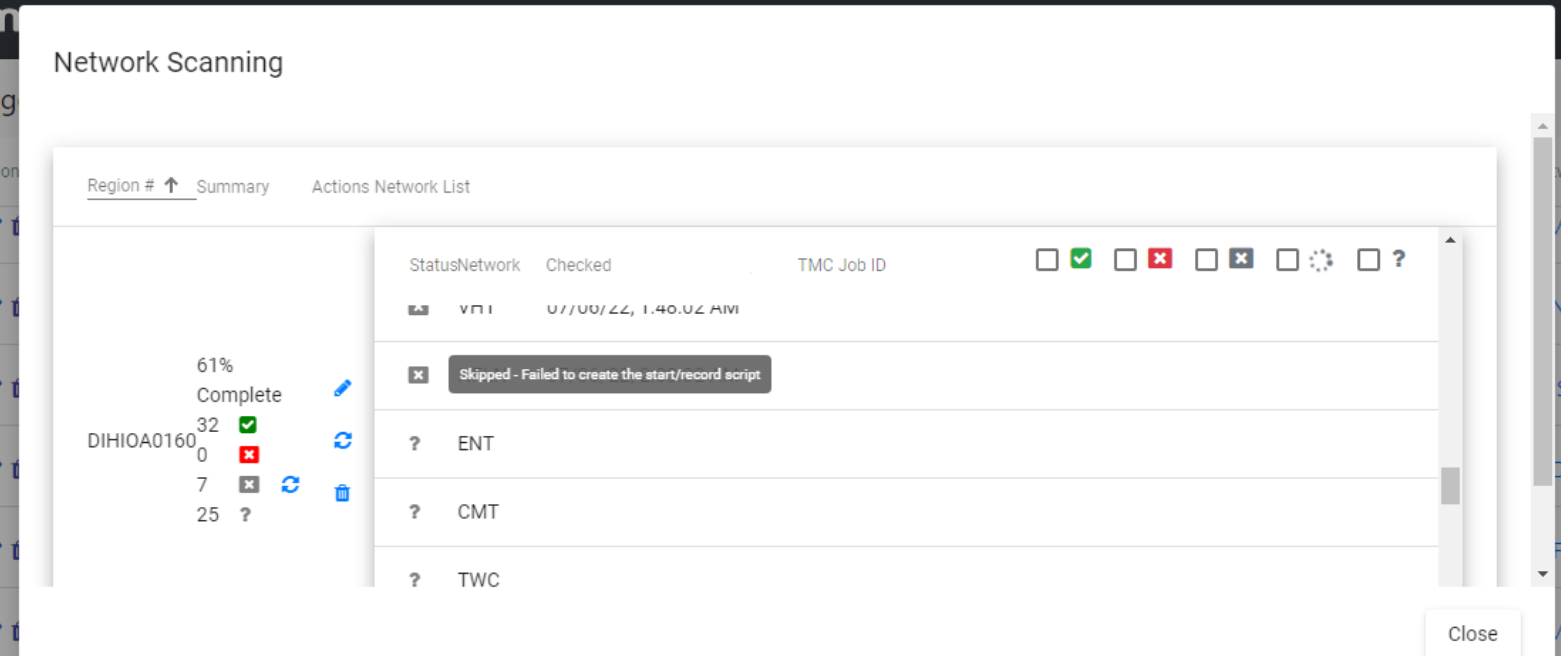
Network Scanning
The Network Scanning navigation will direct to the Network Scanning management page.
It displaying the list of all zones as well as their Verification results, in which it run through the whole list of networks for each active zone.
Add Job
When clicking Add Job on the sub-navigation it will display a modal window allowing the user to add jobs .
This button only appears when accessing the Home page.
Add Sequence
When clicking Add Sequence on the sub-navigation it will display a modal window allowing the user to add job sequence .
This button only appears when accessing the Home page.
Search
The search feature will filter the list by any column in the table for quick lookup. It behaves like a type ahead filter.
Filter Jobs
The Filter Jobs can be collapse or expand after clicking the filter icon on left-menu.
It allows the user to filter jobs according to their active state
Flagged Jobs
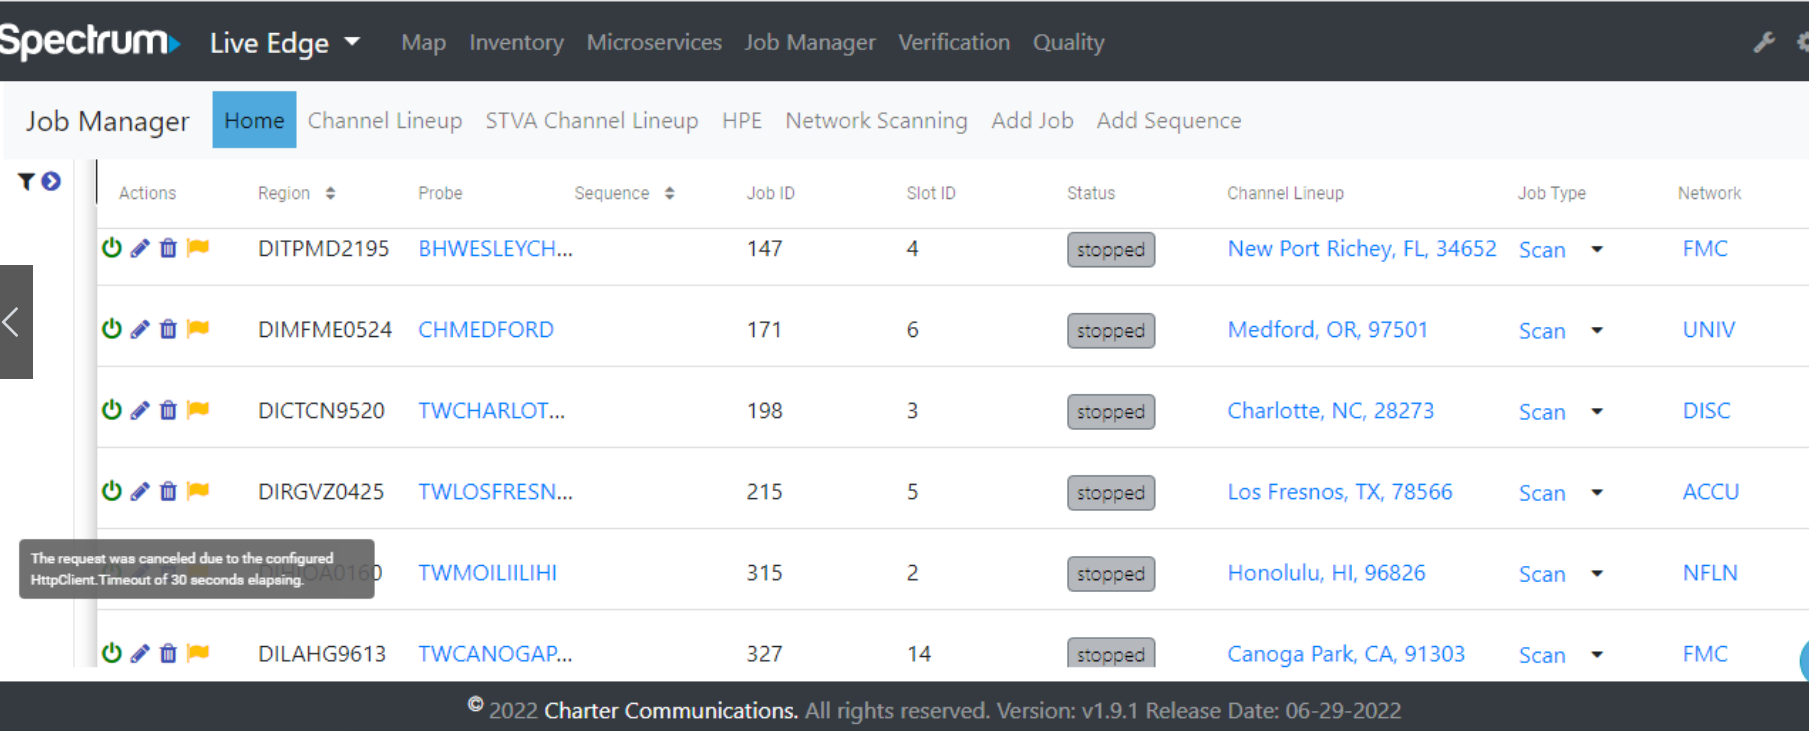
The Flagged Jobs feature is the one that support the user to know the reason why job cannot be run, or what happened to the running job which causing it to be stopped.
When such case happened, the flag icon in the Action column would be automatically turned Yellow, along with the tooltips on the flag to show the details of the problem.
There’re also many problems, so the tooltips message varies as well. However, most of the issue came from the device itself.
Beside the Flag tooltips, user could go into the Scan or List modal in Job Type column, or Network Scanning page to see the full detailed message/stack trace retrieved from the device, displayed as the tooltips for each Network in the Status column.
Below are the most common messages we could meet:
- Flag tooltips: Network has been in playing status for a long time / Network tooltips: Trap not found
- Flag/Network tooltips: Network is stuck at tuning/recording status for a long time. This means the TMC job had an exception while running the start/record script
- Flag: Timeout of 30 seconds elapsing / Network: Failed to create the start/record script. The TMC was unavailable at the moment
- Flag: Another job
- Flag/Network tooltips: An existing reservation by
- Flag tooltips displays the unknown message from TMC job / Network: There was an exception while running start/record script. Most of the cases came from the device itself, where it throw an exception while running